I want you to meet Teddy. Teddy wanna be like pandas. Pandas are cool. Teddy want be cool too!


Reasoning
This library provides some Common Lisp facitilies to work with data frames.
Common Lisp already has numcl to operate on arrays, and now we need a more abstract tool to work with data like data sheets.
Teddy make it possible to define a dataframe full of data, to slice it in different ways, to join data frames and see some statistics about the data.
This is a proof of the concept and API will be changed. Check the ChangeLog.md to learn about new abilities and refactoring details.
How to create a data-frame
Here is how we can create a simple data-frame:
POFTHEDAY> (teddy/data-frame:make-data-frame
            '("Idx" "Integers" "Uniform floats" "Gaussian")
            :rows
            (loop repeat 10
                  for idx upfrom 0
                  collect (list idx
                                (random 100)
                                (random 1.0)
                                (statistics:random-normal
                                 :mean 5.0
                                 :sd 0.2))))
+-----+----------+----------------+----------+
| Idx | Integers | Uniform floats | Gaussian |
+-----+----------+----------------+----------+
|   0 |       41 |           0.27 |   4.89d0 |
|   1 |       98 |           0.08 |   4.93d0 |
|   2 |        8 |           0.45 |   5.15d0 |
|   3 |       56 |           0.63 |   4.87d0 |
|   4 |       79 |           0.42 |   4.72d0 |
|   5 |       19 |           0.04 |   4.73d0 |
|   6 |        1 |           0.34 |   4.93d0 |
|   7 |       79 |           0.60 |   5.25d0 |
|   8 |       42 |           0.08 |   5.10d0 |
|   9 |        7 |           0.86 |   5.31d0 |
+-----+----------+----------------+----------+
Data manipulation
Now we can slice it by columns, rows or both:
POFTHEDAY> (teddy/data-frame:head *d* 2)
+-----+----------+----------------+----------+
| Idx | Integers | Uniform floats | Gaussian |
+-----+----------+----------------+----------+
|   0 |       41 |           0.27 |   4.89d0 |
|   1 |       98 |           0.08 |   4.93d0 |
+-----+----------+----------------+----------+
POFTHEDAY> (teddy/data-frame:tail *d* 2)
+-----+----------+----------------+----------+
| Idx | Integers | Uniform floats | Gaussian |
+-----+----------+----------------+----------+
|   8 |       42 |           0.08 |   5.10d0 |
|   9 |        7 |           0.86 |   5.31d0 |
+-----+----------+----------------+----------+
POFTHEDAY> (teddy/data-frame:slice
            *d*
            :columns '("idx" "gaussian"))
+-----+----------+
| Idx | Gaussian |
+-----+----------+
|   0 |   4.89d0 |
|   1 |   4.93d0 |
|   2 |   5.15d0 |
|   3 |   4.87d0 |
|   4 |   4.72d0 |
|   5 |   4.73d0 |
|   6 |   4.93d0 |
|   7 |   5.25d0 |
|   8 |   5.10d0 |
|   9 |   5.31d0 |
+-----+----------+
POFTHEDAY> (teddy/data-frame:slice *d*
            :columns '("idx" "gaussian")
            :from 4
            :to 6)
+-----+----------+
| Idx | Gaussian |
+-----+----------+
|   4 |   4.72d0 |
|   5 |   4.73d0 |
+-----+----------+
Analyzing data
Also, we might want to see some descriptive statistical data about our data frame. This is pretty easy with Teddy:
POFTHEDAY> (teddy/stats:stats *d*)
+----------------+--------+--------+--------+--------+--------+-------+-------+---------+
| Column         | Min    | p25    | p50    | p75    | Max    | Mean  | SD    | Sum     |
+----------------+--------+--------+--------+--------+--------+-------+-------+---------+
| Idx            |      0 |      2 |   4.50 |      7 |      9 |  4.50 |  3.03 |      45 |
| Integers       |      1 |      8 |  41.50 |     79 |     98 | 43.00 | 34.40 |     430 |
| Uniform floats |   0.04 |   0.08 |   0.38 |   0.60 |   0.86 |  0.38 |  0.27 |    3.75 |
| Gaussian       | 4.72d0 | 4.87d0 | 4.93d0 | 5.15d0 | 5.31d0 |  4.99 |  0.20 | 49.88d0 |
+----------------+--------+--------+--------+--------+--------+-------+-------+---------+
Probably, we can make some extandable protocol to calculate other properties.
Iteration over rows
Data frame stores data as columns. Each column is a vector of particular type. If you want to process a row, you can create an iterator and use it to go through rows like that:
POFTHEDAY> (loop with iterator = (teddy/data-frame:make-iterator *d*)
                 for row = (funcall iterator)
                 while row
                 do (format t "Row: ~S~%"
                            row))
Row: (0 41 0.26806116 4.887522971759381d0)
Row: (1 98 0.081421256 4.928584134866222d0)
Row: (2 8 0.45165908 5.147222819038834d0)
Row: (3 56 0.62647486 4.874349648519968d0)
Row: (4 79 0.41671002 4.7239718274963485d0)
Row: (5 19 0.04152584 4.727268395019779d0)
Row: (6 1 0.3369373 4.93339303609316d0)
Row: (7 79 0.59791017 5.2466443304900965d0)
Row: (8 42 0.076958776 5.103448455243024d0)
Row: (9 7 0.85732913 5.310498824093041d0)
Plotting data
Plotting facilities as rudimentary. All functions related to plotting
are in the teddy/plot package. Right now GNUPlot is used via
eazy-gnuplot library.
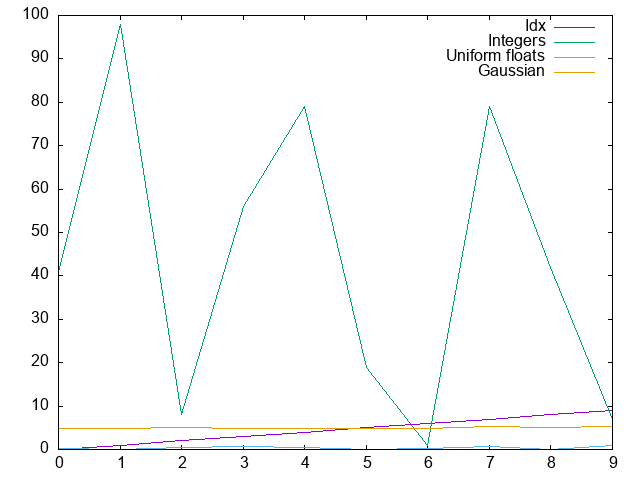
Here is how we can plot our data from all columns:
POFTHEDAY> (teddy/plot:plot *d*
            "docs/media/0099/simple-plot.png")

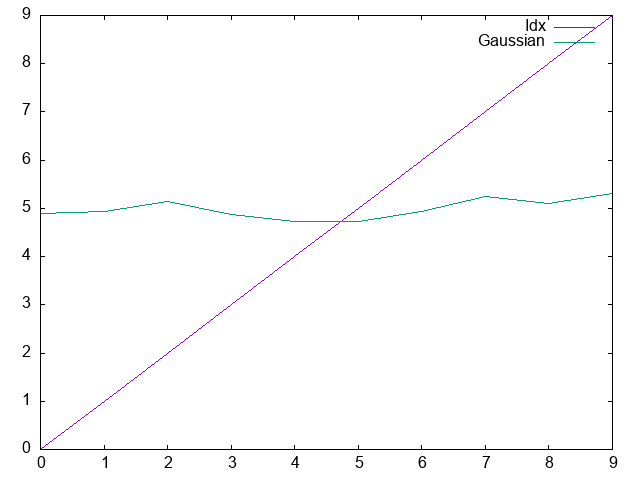
If we want to plot only gaussian, then it will be wrong, because we need histogram type of plot. This it "to be done":
POFTHEDAY> (teddy/plot:plot
            (teddy/data-frame:slice *d*
                                    :columns '("Idx" "Gaussian"))
            "docs/media/0099/gaussian.png")

Another type of plots Teddy is able to render right now is a
"timeseries":
POFTHEDAY> (defparameter *moscow-population*
             (teddy/data-frame:make-data-frame
              '("Date" "Population")
              :rows '(("1350-01-01" 30000)
                      ("1840-01-01" 349000)
                      ("1907-01-01" 1345700)
                      ("1967-01-01" 6422000)
                      ("1994-01-01" 9066000)
                      ("2010-01-01" 11500000)
                      ("2020-01-01" 12680000))))
*MOSCOW-POPULATION*
POFTHEDAY> (teddy/plot:plot-timeseries
            *moscow-population* "docs/media/0099/moscow2.png"
            :title "Moscow population")
"docs/media/0099/moscow.png"


Join the effort to make Teddy really useful for data analysis!
Right now, Teddy installable only from Ultralisp, because it is the best place to host unstable fast changing Common Lisp libraries.
Credentials
- Logo is by JenDigitalArt, was downloaded from Pixabay.
API Documentation
Package: TEDDY/UTILS
Functions
ensure-vector ( obj &key element-type )
infer-type ( value )
vector-to-list ( vector )
Package: TEDDY/DATA-FRAME
Classes
data-frame
Functions
column-idx ( data-frame name )
Returns a number of the column
get-column ( data-frame name &key ( as :vector ) )
Returns column by name
head ( data-frame &optional ( rows 10 ) )
make-data-frame ( column-names &key rows columns types )
make-iterator ( data-frame )
Returns a function from zero arguments which will return a next row on each call. When all rows will be returned, iterator will return nil.
Rows are returned as lists.
make-value-formatter ( num-digits-after-point )
num-columns ( data-frame )
num-rows ( data-frame )
set-num-digits-after-point ( num )
slice ( data-frame &key columns from to )
tail ( data-frame &optional ( rows 10 ) )
Generic-function-node
scalar ( obj row-idx column-name )
Returns a cell content corresponding to the row-idx and column-name.
Methods
scalar ( ( data-frame data-frame ) row-idx column-name )
Returns a cell content corresponding to the row-idx and column-name.
Package: TEDDY/INDEX
Classes
index
Functions
make-index ( data-frame column )
row-index ( index value )
Internal function to getting the row index by the value.
Methods
scalar ( ( index index ) value column-name )
Returns a cell content corresponding to the value and column-name.
Package: TEDDY/STATS
Functions
stats ( data-frame )
Returns a new dataframe where each column holds different stats on corresponding columns from original data-frame.
Package: TEDDY/PLOT
Functions
filename->terminal ( filename )
Transforms string or pathname into a list suitable for passing as :terminal value to eazy-gnuplot:gp-setup.
plot ( data-frame filename &key title debug )
plot-timeseries ( dataframe filename &key ( x "date" ) y title )
Plots a timeseries where axis x has a timestamp values. If column for axis y is not given, then second column will be used.