
Lisp Project of the Day
teddy
You can support this project by donating at:


Or see the list of project sponsors.
teddy
| Documentation | 😀 |
| Docstrings | 😀 |
| Tests | 🤨 |
| Examples | 😀 |
| RepositoryActivity | 😀 |
| CI | 😀 |
I always wanted to work from Common Lisp with data like we do in Python. That is how does Teddy born.
Teddy make it possible to define a data frame full of data, to slice it in different ways, to join data frames, see some statistics about the data and render plots.
This is a proof of the concept and API will be changed. Check the ChangeLog.md to learn about new abilities and refactoring details.
Here is how we can create a simple data frame:
POFTHEDAY> (teddy/data-frame:make-data-frame
            '("Idx" "Integers" "Uniform floats" "Gaussian")
            :rows
            (loop repeat 10
                  for idx upfrom 0
                  collect (list idx
                                (random 100)
                                (random 1.0)
                                (statistics:random-normal
                                 :mean 5.0
                                 :sd 0.2))))
+-----+----------+----------------+----------+
| Idx | Integers | Uniform floats | Gaussian |
+-----+----------+----------------+----------+
|   0 |       41 |           0.27 |   4.89d0 |
|   1 |       98 |           0.08 |   4.93d0 |
|   2 |        8 |           0.45 |   5.15d0 |
|   3 |       56 |           0.63 |   4.87d0 |
|   4 |       79 |           0.42 |   4.72d0 |
|   5 |       19 |           0.04 |   4.73d0 |
|   6 |        1 |           0.34 |   4.93d0 |
|   7 |       79 |           0.60 |   5.25d0 |
|   8 |       42 |           0.08 |   5.10d0 |
|   9 |        7 |           0.86 |   5.31d0 |
+-----+----------+----------------+----------+
Now we can slice it by columns, rows or both:
POFTHEDAY> (teddy/data-frame:head *d* 2)
+-----+----------+----------------+----------+
| Idx | Integers | Uniform floats | Gaussian |
+-----+----------+----------------+----------+
|   0 |       41 |           0.27 |   4.89d0 |
|   1 |       98 |           0.08 |   4.93d0 |
+-----+----------+----------------+----------+
POFTHEDAY> (teddy/data-frame:tail *d* 2)
+-----+----------+----------------+----------+
| Idx | Integers | Uniform floats | Gaussian |
+-----+----------+----------------+----------+
|   8 |       42 |           0.08 |   5.10d0 |
|   9 |        7 |           0.86 |   5.31d0 |
+-----+----------+----------------+----------+
POFTHEDAY> (teddy/data-frame:slice
            *d*
            :columns '("idx" "gaussian"))
+-----+----------+
| Idx | Gaussian |
+-----+----------+
|   0 |   4.89d0 |
|   1 |   4.93d0 |
|   2 |   5.15d0 |
|   3 |   4.87d0 |
|   4 |   4.72d0 |
|   5 |   4.73d0 |
|   6 |   4.93d0 |
|   7 |   5.25d0 |
|   8 |   5.10d0 |
|   9 |   5.31d0 |
+-----+----------+
POFTHEDAY> (teddy/data-frame:slice *d*
            :columns '("idx" "gaussian")
            :from 4
            :to 6)
+-----+----------+
| Idx | Gaussian |
+-----+----------+
|   4 |   4.72d0 |
|   5 |   4.73d0 |
+-----+----------+
Also, we might want to see some descriptive statistical data about our data frame. This is pretty easy with Teddy:
POFTHEDAY> (teddy/stats:stats *d*)
+----------------+--------+--------+--------+--------+--------+-------+-------+---------+
| Column         | Min    | p25    | p50    | p75    | Max    | Mean  | SD    | Sum     |
+----------------+--------+--------+--------+--------+--------+-------+-------+---------+
| Idx            |      0 |      2 |   4.50 |      7 |      9 |  4.50 |  3.03 |      45 |
| Integers       |      1 |      8 |  41.50 |     79 |     98 | 43.00 | 34.40 |     430 |
| Uniform floats |   0.04 |   0.08 |   0.38 |   0.60 |   0.86 |  0.38 |  0.27 |    3.75 |
| Gaussian       | 4.72d0 | 4.87d0 | 4.93d0 | 5.15d0 | 5.31d0 |  4.99 |  0.20 | 49.88d0 |
+----------------+--------+--------+--------+--------+--------+-------+-------+---------+
Probably, we can make some extandable protocol to calculate other properties.
Data frame stores data as columns. Each column is a vector of a particular type. If you want to process a row, you can create an iterator and use it to go through rows like that:
POFTHEDAY> (loop with iterator = (teddy/data-frame:make-iterator *d*)
                 for row = (funcall iterator)
                 while row
                 do (format t "Row: ~S~%"
                            row))
Row: (0 41 0.26806116 4.887522971759381d0)
Row: (1 98 0.081421256 4.928584134866222d0)
Row: (2 8 0.45165908 5.147222819038834d0)
Row: (3 56 0.62647486 4.874349648519968d0)
Row: (4 79 0.41671002 4.7239718274963485d0)
Row: (5 19 0.04152584 4.727268395019779d0)
Row: (6 1 0.3369373 4.93339303609316d0)
Row: (7 79 0.59791017 5.2466443304900965d0)
Row: (8 42 0.076958776 5.103448455243024d0)
Row: (9 7 0.85732913 5.310498824093041d0)
Plotting facilities as rudimentary, but should be improved.. All functions related to plotting are in the teddy/plot package. Right now GNUPlot is used via eazy-gnuplot library.
Here is how we can plot our data from all columns:
POFTHEDAY> (teddy/plot:plot *d*
            "docs/media/0099/simple-plot.png")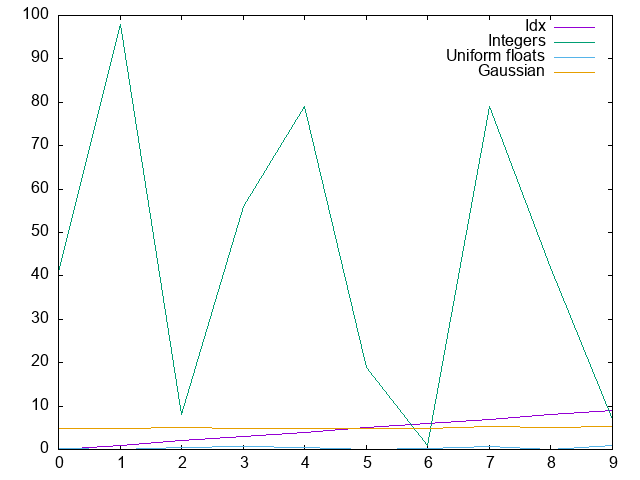
If we want to plot only gaussian, then it will be wrong, because we need a histogram type of plot. This feature is "to be done":
POFTHEDAY> (teddy/plot:plot
            (teddy/data-frame:slice *d*
                                    :columns '("Idx" "Gaussian"))
            "docs/media/0099/gaussian.png")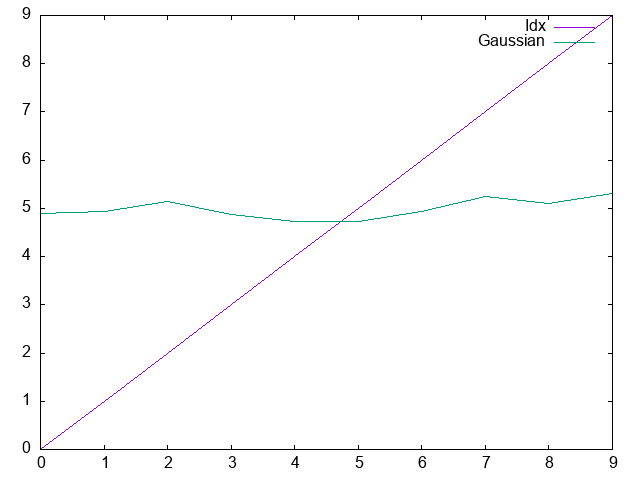
Another type of plots Teddy is able to render right now is a "timeseries".
Let's plot how does Moscow's population was changed over years:
POFTHEDAY> (defparameter *moscow-population*
             (teddy/data-frame:make-data-frame
              '("Date" "Population")
              :rows '(("1350-01-01" 30000)
                      ("1840-01-01" 349000)
                      ("1907-01-01" 1345700)
                      ("1967-01-01" 6422000)
                      ("1994-01-01" 9066000)
                      ("2010-01-01" 11500000)
                      ("2020-01-01" 12680000))))
*MOSCOW-POPULATION*
POFTHEDAY> (teddy/plot:plot-timeseries
            *moscow-population* "docs/media/0099/moscow2.png"
            :title "Moscow population")
"docs/media/0099/moscow.png"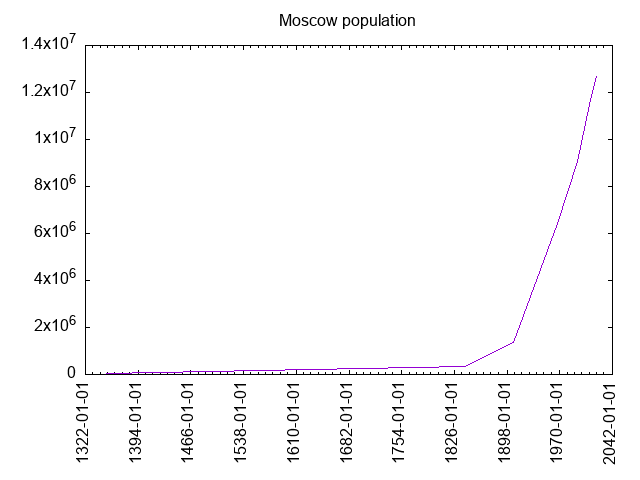
Right now, Teddy installable only from Ultralisp, because it is the best place to host unstable fast-changing Common Lisp libraries.
Join the effort to make Teddy really useful for data analysis!
Send your pull-requests to:
Brought to you by 40Ants under 